The Russell 2000: A Sleeping Giant on the Verge of Awakening
A Tale of Two Markets
While the major indices have soared to unprecedented heights, the Russell 2000 Index has lagged behind, posting a meager 7% return over the past year. This stark contrast has left investors wondering if the small caps will ever catch up.
A Range-Bound Enigma
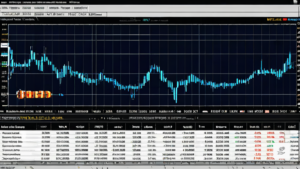
The E-Mini Russell 2000 Index Futures have been trapped in a narrow range for months, with resistance at $2000 and support at $1620. This consolidation has frustrated traders, who have been unable to capitalize on significant market moves.
A Critical Juncture
The index is currently testing the upper boundary of this range. A decisive breakout could signal a change in momentum, with the small caps finally joining the rally that has propelled the major indices.
Key Levels to Watch
Resistance: The key resistance level is just above $2000. A sustained break above this level would indicate a bullish breakout and could trigger a surge in buying pressure.
Support: The critical support level is at $1902.8. A breach of this level could lead to a sharp decline and potentially a retest of the lower range boundary at $1620.
Technical Indicators
The Momentum indicator has been fluctuating, reflecting the indecisive nature of the market. However, the 50-day and 200-day Simple Moving Averages (SMAs) are trending upward, suggesting that the bulls may have the upper hand.
A Doji Dilemma
On the daily chart, a Doji candlestick has formed at the resistance level. This candlestick pattern often indicates indecision and can precede a reversal. However, it’s important to note that a Doji does not guarantee a reversal, and confirmation is needed.
Trading Strategies
Bullish Scenario
If the index breaks decisively above the $2000 resistance level, it could present a bullish entry point. Targets can be set higher based on breakout momentum, with stop losses placed just below the breakout level or the 50-day SMA for tighter risk management.
Bearish Scenario
A rejection at the resistance, particularly if followed by a downward move through the 50-day SMA, could be a sign to consider short positions. Targets would be toward the lower end of the range, with stop losses placed above the range’s resistance or the recent high.
It’s crucial to manage risk and adjust positions according to the market’s response at these key levels. While the Doji candlestick at resistance can imply indecision, it doesn’t guarantee a reversal. Patience and confirmation are key in navigating this potentially volatile market.