Unveiling the Intriguing Dynamics of the NASDAQ 100 E-mini Futures
A Journey Through the Weekly Chart
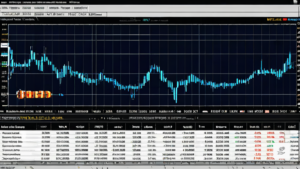
The NASDAQ 100 E-mini Futures have embarked on an impressive upward trajectory, leaving a trail of consecutive higher highs and higher lows in their wake. This bullish trend is further reinforced by the MACD indicator, which confidently resides above the signal line and exudes positivity. However, a closer examination reveals a subtle waning of momentum, as the histogram’s bars gradually diminish in size.
The Average True Range (ATR) has maintained a steady presence, suggesting a consistent level of volatility within the market. This stability provides traders with a reliable gauge for assessing price fluctuations.
Navigating Key Levels on the Weekly Chart
As we navigate the weekly chart, we encounter crucial resistance at the current price level of 17961.75. A decisive push beyond this barrier could propel the market towards uncharted territories and potentially lead to the establishment of new highs. Conversely, the 17000 mark emerges as a pivotal support level, aligning with previous areas of consolidation.
Exploring the Daily Chart
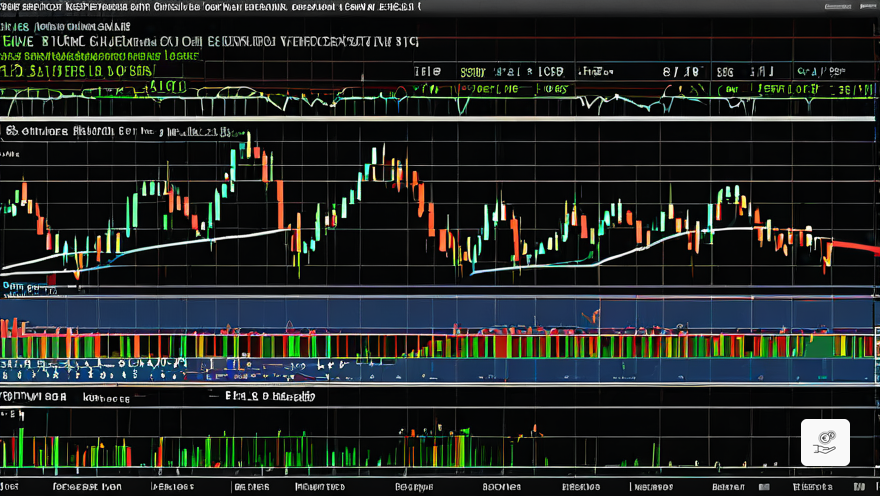
Shifting our focus to the daily chart, we discern the formation of a potential rising wedge pattern. This configuration often serves as a reversal pattern, signaling a potential change in the prevailing trend if the price succumbs to a breakdown. Moreover, we observe a bearish divergence with the RSI, where the price ascends to higher highs while the RSI fails to keep pace, indicating a weakening of the bullish momentum.
Identifying Key Levels on the Daily Chart
On the daily chart, the upper trendline of the wedge, situated near 18120.50, presents itself as an immediate resistance level. Conversely, the 50-day moving average, currently resting at 17718.10, may offer temporary respite as a support level.
Unveiling Potential Trading Opportunities
Armed with these insights, we can now contemplate potential trading strategies. In a bullish scenario, should the price maintain its position above the 50-day moving average and successfully breach the upper trendline of the wedge, a long position could be considered, targeting the 18120.50 level. To mitigate potential risks, a stop loss could be strategically placed beneath the 50-day moving average.
Alternatively, a bearish scenario could unfold if the price succumbs to a breakdown below the 50-day moving average. In such an event, a short trade opportunity may arise, with the next support level around 17000 serving as the target. To safeguard against potential losses, a stop loss could be positioned above the 50-day moving average.
It is imperative to remain vigilant, closely monitoring these key levels and adapting strategies as the market evolves. The rising wedge formation and RSI divergence warrant meticulous attention, as they may provide valuable clues regarding a potential reversal in the prevailing trend. Prudent risk management remains paramount, as markets can often exhibit unpredictable behavior.