Analyzing Oil Futures Across Different Timeframes
Weekly Overview
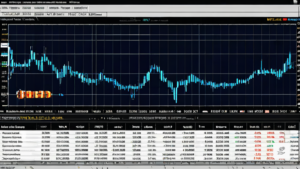
Analyzing the Light Crude Oil Futures on the weekly chart reveals a distinct consolidation pattern enclosed within a well-defined support range. The Volume Profile Visible Range (VPVR) signals significant trading activity at these specific levels. The Relative Vigor Index (RVI) demonstrates a stable momentum, with the RVI line positioned slightly above its moving average, hinting at a subtle bullish inclination in the medium term.
Daily Inspection
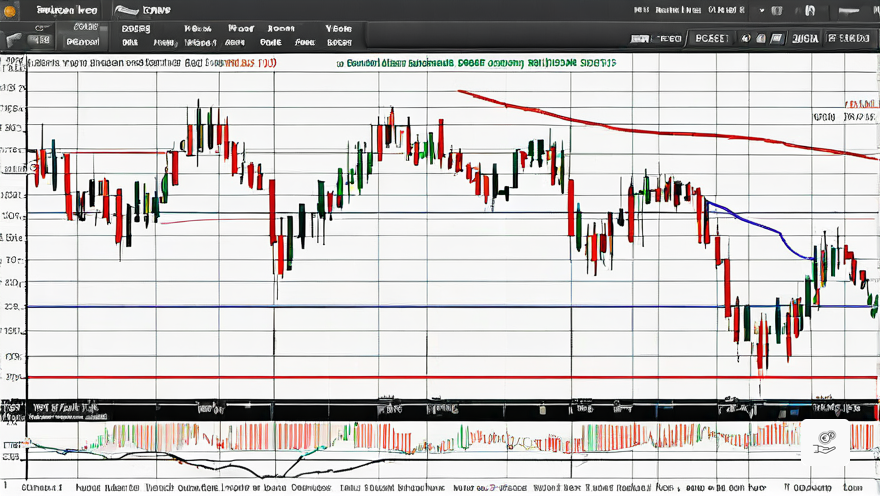
Examining the daily timeframe, the price movement is contained within the Simple Moving Averages (SMAs). The 50-day SMA at 74.35 acts as a dynamic support, while the 200-day SMA at 77.58 functions as a nearby resistance level. The convergence of these moving averages distinctly signifies a sideways market. Additionally, the trendline support, originating from the lows, further reinforces the bullish framework.
Hourly Evaluation
A detailed scrutiny of the hourly Heikin Ashi chart illustrates a consolidation phase above the pivot point of $77.49, with immediate support and resistance thresholds identified at $76.06 and $78.95, respectively.
Significant Levels to Monitor
The pivotal levels for the Light Crude Oil Futures are as follows: – Support Range: $76.00 to $76.26, which has consistently attracted buyers into the market. – Resistance Range: $80.00 to $81.84, known for halting previous upswings and serving as the target area for bullish breakthroughs.
Potential Trading Opportunities
Traders seeking to leverage the current market scenario could consider initiating long positions at the lower edge of the support range, with a stop-loss positioned just below $76.00. The primary objective for this bullish trade is the lower boundary of the resistance range at $80.00, with a potential extension to $81.84 if momentum persists.
Market Outlook
Based on the prevailing technical setup, a positive outlook is upheld for Light Crude Oil Futures. The confirmation of support levels, along with the possibility of a bullish SMA crossover and the RVI signaling a slight bullish momentum, forms a solid foundation for anticipating upward price movements. It is imperative to observe the market’s response at the crucial support zone to validate the bullish position, with any breach below this level necessitating a reassessment of the optimistic forecast.