Navigating the Market Trends: An Analysis

Weekly Market Outlook
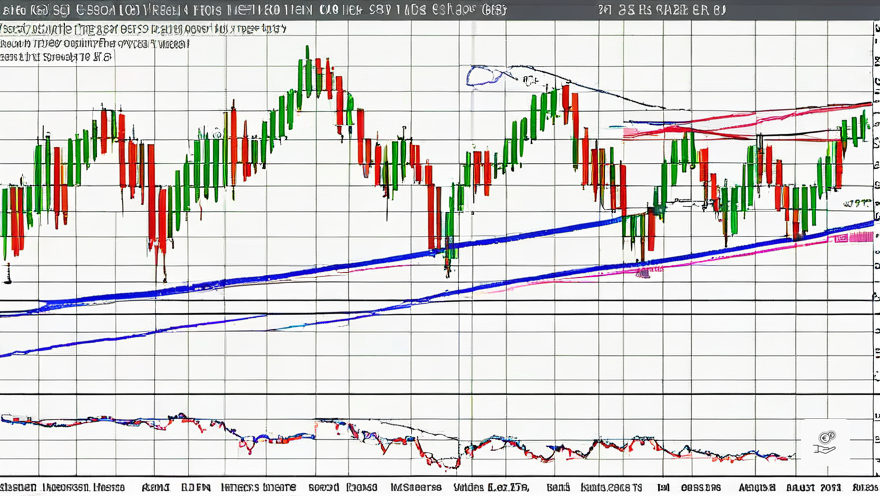
The Nikkei Futures have been showcasing a robust upward momentum on the weekly chart. This bullish trend is highlighted by the StellarTrend indicator, which has maintained a persistent green status. Additionally, the Awesome Oscillator (AO) reflects positivity as the Japanese index continues its ascent to reach new peaks.
Key Weekly Levels
When examining the weekly chart, it’s crucial to monitor the SuperTrend line located at 34917.57, serving as a dynamic support zone. As long as the price remains above this level, the overarching bullish trajectory remains unbroken. In terms of resistance, the recent peak at approximately 39260 presents an immediate hurdle. A decisive weekly close above this mark could indicate sustained bullish momentum.
Daily Performance Analysis
The daily price action portrays a strong position above both the 50-day SMA at 35493 and the 200-day SMA at 33926, affirming the strength of the ongoing uptrend. With the RSI entering overbought territory, there is a possibility of a brief retreat or consolidation phase, potentially accompanied by mild bearish divergence signals.
Key Daily Levels
For daily insights, the 50-day SMA at 35493 emerges as a key support level. On the resistance front, the recent high at 39260 stands out as a pivotal barrier that traders should monitor closely for potential breakout scenarios.
Short-Term Analysis
A closer look at the 15-minute Heikin Ashi chart reveals a consolidation phase, with the price hovering around the pivot point (P) positioned at 38780. The Heikin Ashi candles suggest a temporary pause in the trend following a pronounced directional move.
Key Levels in the Short Term
The pivotal level at 38780 serves as a significant juncture on the 15-minute chart. Maintaining levels above this point could indicate a bullish inclination for the short term, with potential upward price movements.
Potential Trading Strategies
In terms of potential trades, a bullish approach may be considered if the price sustains above the pivot point. Traders could contemplate a long position with a target at the daily high of 39260, setting stop losses below the pivot point or the 50-day SMA based on individual risk preferences. Conversely, a bearish stance could be adopted if the price breaches below the pivot point, leading to a short position with a target set at the 50-day SMA at 35493. Implementing a stop loss above the pivot point can mitigate potential losses if the anticipated downtrend fails to materialize.


