Deciphering Market Trends: A Comprehensive Analysis
Weekly Insights
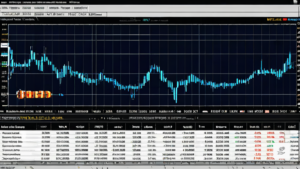
Upon analyzing the weekly chart, a notable candlestick pattern, known as a hanging man, has emerged. This pattern often signals a potential reversal or a significant pause in the ongoing uptrend. However, it’s imperative to exercise caution before jumping to conclusions. Despite witnessing a remarkable uptrend with an impressive streak of 14 green candles out of the last 16 weeks, it’s premature to declare a top. The volume, a key indicator, has maintained relative stability without any sudden surges, indicating a lack of urgency among traders to exit their positions.
Weekly Key Levels to Monitor
Immediate Support: The psychological level around 5000 remains crucial for sustaining the current uptrend in the short term.
Potential Reversal Confirmation: A watchful eye on subsequent candles forming lower lows could confirm the hanging man pattern as a reversal signal.
Daily Overview
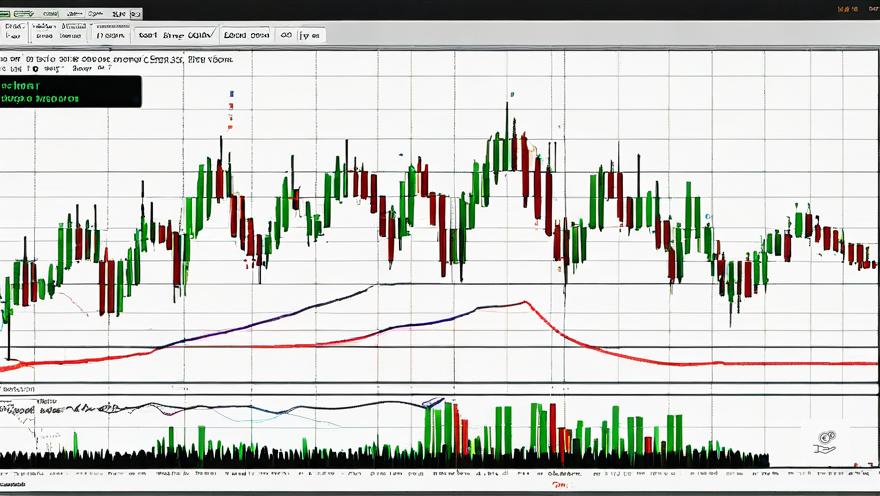
The daily charts exhibit a clear uptrend, with price action comfortably above both the 50-day SMA (Simple Moving Average) and the 200-day SMA. The immediate support is identified around the Trend Magic at 4999.40. While the Awesome Oscillator (AO) indicates a reduction in momentum with diminishing green bars, it’s not necessarily indicative of an imminent reversal.
Daily Key Levels to Keep an Eye On
Support: The Trend Magic at 4999.40 serves as the primary support level for bullish momentum.
Resistance: The 5100 level emerges as a potential target for bulls if momentum strengthens.
Hourly Analysis
A closer look at the 1-hour Heikin Ashi chart reveals a period of consolidation, with the price oscillating around the pivot point at 5006.50. The smooth Heikin Ashi candles reflect a state of indecision in the current trend.
Hourly Key Levels for Consideration
Resistance 1 (R1): A breach above 5076.50 could pave the way for testing higher resistance levels.
Support 1 (S1): Positioned at 4946.50, this level offers a potential entry point for bullish trades, provided the price maintains its overall uptrend.
Potential Trading Scenarios
Bullish Outlook: Opportunities may arise on a rebound from the Trend Magic at 4999.40 or the pivot point at 5006.50. A prudent strategy involves setting a stop loss below S1 at 4946.50 and targeting R1 at 5076.50.
Bearish Possibility: In case of a breakdown below the Trend Magic at 4999.40, short positions could be considered, targeting S1 at 4946.50. However, it’s crucial to note that this approach contradicts the prevailing uptrend and carries inherent risks.
Assessment and Final Thoughts
Considering the overall trend and the current chart patterns, a bullish sentiment persists for the S&P 500 E-mini Futures (ES). Despite the potential reversal signal indicated by the hanging man pattern and the waning momentum as suggested by the AO, the overarching trend remains upward, supported by key moving averages. It’s essential to remember the adage, ‘the trend is your friend until it bends at the end.’ As of now, there are no visible indications of a trend reversal. However, it’s prudent to remain adaptable to evolving market conditions. Hence, while maintaining a bullish stance, we remain vigilant to adjust our strategy if dictated by the unfolding price action.