DXY: Navigating the Triangular Crossroads

The DXY’s Enigmatic Triangle
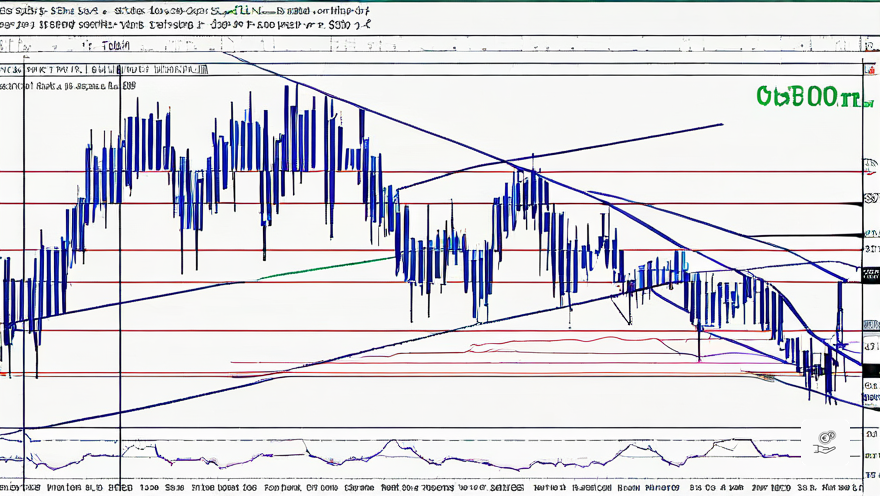
The U.S. Dollar Index (DXY) has painted an intriguing pattern on its weekly chart: a symmetrical triangle. This enigmatic formation can hint at either a continuation or a reversal in the index’s trajectory, depending on which way it decides to break out.
Currently, the DXY is perched precariously at the apex of this triangle, hovering within a long-standing support/resistance zone. This delicate balance has traders on the edge of their seats, eagerly anticipating the index’s next move.
Key Levels: The Battleground
Weekly Chart
On the weekly chart, the lower trendline of the triangle, near 101.946, stands as a formidable support level. A decisive breach below this line could unleash a wave of bearish momentum, potentially leading to further declines.
Conversely, the upper trendline, currently intersecting near 103.679, serves as the immediate resistance. Should the DXY muster the strength to break above this barrier, it could propel the index towards the distant horizontal resistance at 114.791.
Daily Chart
Zooming into the daily timeframe, we find the DXY trading just above the 50-day Simple Moving Average (SMA) at 103.172. This level neatly aligns with the lower boundary of the triangle pattern observed on the weekly chart.
The 200-day SMA currently resides below the price, but its flat trajectory suggests a lack of a clear trend on the daily timeframe.
Technical Indicators: Unveiling the Hidden Forces
RSI: Neutral Territory
The Relative Strength Index (RSI) on the weekly chart hovers around the neutral zone, indicating that the DXY has room to maneuver in either direction. It is neither overbought nor oversold, leaving traders in a state of anticipation.
AO: A Hint of Bullishness
On the daily chart, the Awesome Oscillator (AO) indicator displays a modest positive momentum. This could potentially support a bullish breakout from the triangle pattern.
Potential Trades: Navigating the Uncertainty
Bullish Scenario: Breaking the Resistance
If the DXY manages to break above the triangle’s upper trendline, traders may consider a long entry. The target for this trade would be the horizontal resistance at 114.791. A stop loss can be placed just below the breakout level to mitigate risk.
Bearish Scenario: Falling Through the Support
Should the DXY succumb to bearish pressure and break below the triangle’s lower trendline, a short trade could be in order. The target in this scenario would be the next significant support level. The stop loss should be positioned just above the trendline to minimize potential losses.
Conclusion: The DXY’s Impending Decision
As the DXY approaches the apex of its triangular formation, traders are holding their breath in anticipation. The breakout direction will likely shape the index’s trajectory for the foreseeable future.
It is crucial for traders to implement sound risk management strategies, given the volatile nature of index movements. By carefully monitoring the price action and respecting key levels, traders can navigate the DXY’s crossroads with confidence.


