Gold’s Ascent: Navigating Resistance and Support Levels
Gold’s Journey: A Crossroads of Resistance and Support
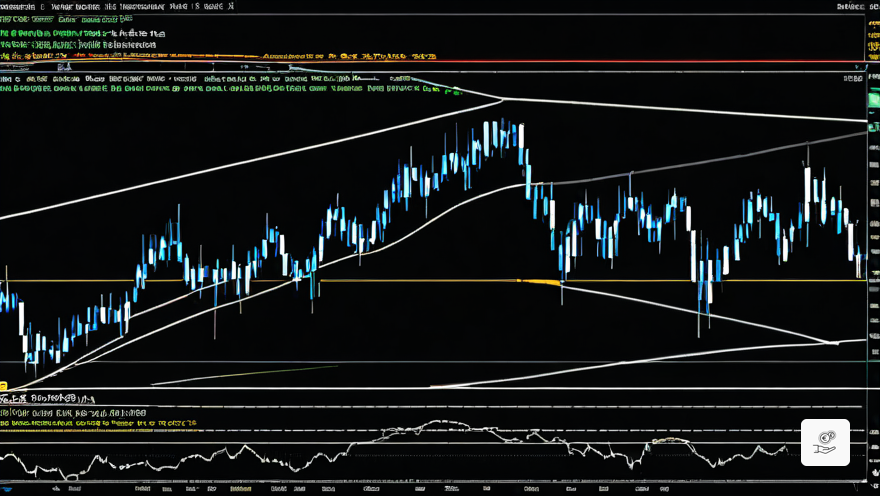
Gold Futures stand poised at a pivotal juncture, where the formidable resistance of the Previous All-Time High (ATH) at $2093.2 looms large. This critical level has long been a formidable barrier, and its breach could herald a new era of bullish momentum.
Beneath this formidable resistance lies an ascending support line, forming a distinctive ascending triangle. A decisive break below this support could signal a shift in market dynamics, but the current market environment suggests otherwise.
Momentum’s Embrace: A Bullish Signal
The Momentum indicator stands as a beacon of optimism, indicating persistent buying pressure. This bullish sentiment adds weight to the possibility of an upward trajectory.
Weekly Compass: Key Levels to Guide Your Journey
On the weekly chart, the immediate resistance to conquer lies at the ATH of $2093.2. A decisive close above this level would unleash a surge of bullish energy, potentially propelling prices higher.
Guarding the downside is the ascending trend line, currently hovering near the $1880 region. A break below this support could raise concerns, but the prevailing market conditions suggest a low probability of such an occurrence.
Daily Insights: Volatility and Psychological Barriers
The daily timeframe reveals a surge in volatility as Gold Futures approached the ATH resistance level. This surge coincided with the release of key inflation data, further fueling market uncertainty.
The 50-day Simple Moving Average (SMA) maintains its bullish stance above the 200-day SMA, a positive sign as the gap between the two averages widens.
Daily Markers: Navigating Support and Resistance
On the daily chart, the $2100 round figure emerges as a potential psychological resistance level, adding to the significance of the ATH.
On the support front, the 50-day SMA at $2043.2 stands as the first line of defense, with the 200-day SMA at $1981.4 providing a more robust support zone.
Trading Strategies: Embracing Opportunities and Mitigating Risks
Should a strong weekly close materialize above the ATH, a bullish scenario could unfold, presenting an opportunity to enter long positions with a target of $2100 or even higher. Stop losses should be placed below the weekly ascending support line.
Given the dynamic market environment and the significance of the ATH level, traders must remain vigilant for volatility and swift price movements. A confirmed breakout or rejection at the ATH will provide valuable insights into the market’s true intentions.
Remember, the markets can often defy expectations, making it imperative to employ stop losses as a protective measure against potential losses.