Gold’s Triumphant Ascent: A Technical Analysis for Bulls and Bears

The Golden Breakthrough
Gold has shattered its previous zenith, exhibiting remarkable vigor. This explosive surge has propelled GC futures beyond the all-time high, marking a pivotal moment for the precious metal. As we navigate the end of 2023, let’s delve into the technical indicators and explore the potential paths for bulls and bears.
Weekly Chart: Triple Top’s Demise
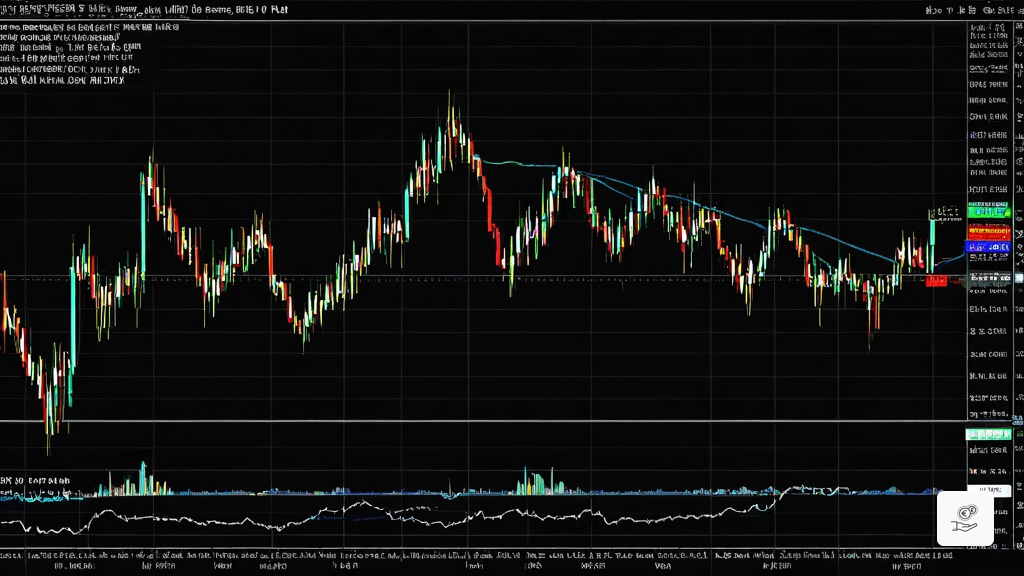
The once-formidable triple top has succumbed to the relentless upward momentum of Gold. The three peaks, formed in July 2020, June 2022, and December 2024, have been decisively breached, signaling a setback for the bearish camp. However, the significance of this week’s closing price cannot be overstated.
History suggests that Gold has often experienced significant retracements of 20% or more after reaching similar highs. Prudent traders holding long positions should implement strict stop-loss measures to mitigate potential risks.
Daily Chart: Golden Cross and Inverted Hammer
The daily chart provides further bullish confirmation with the formation of a golden cross. This bullish pattern occurs when the 50-day moving average crosses above the 100-day moving average, signaling a shift in momentum. The last such golden cross occurred in July, adding weight to the current bullish sentiment.
However, bulls should proceed with caution as today’s candle currently resembles an inverted hammer. It is prudent to await the end of the week and observe the weekly close before considering potential trades.
Crucial Levels to Monitor
The most immediate level to watch is the previous all-time high of $2060.80, which could provide support in the event of a retracement. The next significant level is the recent high of $2152.3. A decisive break above this level this week would strengthen the bullish case.
In the event of a decline, the 50-day moving average and the support zone at $1930 will be crucial areas to monitor.


