Mastering Order Flow Analysis in Trading for Successful Traders

Unlocking the Power of Order Flow in Trading
Understanding the intricacies of technical indicators is pivotal in trading endeavors. While these tools may not be infallible, delving into the realm of order flow can provide invaluable insights into stock and derivative price behaviors. This comprehensive guide will shed light on what order flow entails and how it can be leveraged to craft effective trading strategies.
Deciphering Order Flow Dynamics
Order flow analysis involves scrutinizing the flow of orders to anticipate its impact on prices. It offers a microscopic view of how market participants influence the market, akin to dissecting candlestick patterns. By discerning the balance between buyers and sellers, traders can predict price movements. An abundance of sellers may drive prices down, while a surge in buyers can propel prices upwards, granting sellers the advantage of price flexibility.
Exploring the Relationship Between DOM, Market Orders, and Order Flow
Before embarking on order flow analysis, it is imperative to grasp the significance of terms such as Depth of Market (DOM), market orders, and limit orders. DOM provides visibility into buy and sell orders, with higher volume indicating market depth and liquidity. Market orders execute at the best available price but do not guarantee a specific price, while limit orders trigger only at predetermined levels, influencing the order flow dynamics.
Tools for Analyzing Order Flow
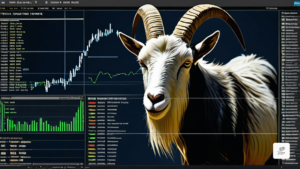
Order flow analysis often integrates with technical analysis, with the order book being a primary tool. A commonly utilized tool is the footprint chart, which showcases executed orders and their impact on price movements. Each bar in the chart comprises multiple candlesticks, offering a detailed breakdown of buying and selling pressures through color-coded numbers.
Navigating the Footprint Chart for Order Flow Insights
Delving into individual candlesticks on a footprint chart unveils a wealth of information. The color-coded figures represent buying and selling pressures, with the volume point of control indicating peak trading volumes. Traders can configure these charts based on their preferences to identify buying or selling intensity, aiding in pattern recognition and trend analysis.
Crafting a Simple Order Flow Trading Strategy
Order flow tools, like technical charts, serve as potent pattern detection mechanisms for traders. Integrating them with other indicators enhances trading precision. By analyzing the order book and footprint charts, traders can identify support and resistance levels, facilitating informed decision-making in trend reversals and price movements.
Real-Life Application of Order Flow Trading
Examining a real-world order flow trading scenario elucidates the practicality of this approach. By combining order flow analysis with additional indicators, traders can gauge market sentiment and make informed trading choices. Detecting buy and sell signals, as well as trend reversals, becomes more intuitive through a meticulous study of order flow patterns.
Insights and Conclusions
Order flow analysis equips traders with a strategic edge by uncovering market dynamics and optimizing trading decisions. From identifying trend strengths to predicting reversals, order flow tools offer a comprehensive view of asset liquidity and price impact. While some platforms may lack robust order flow features, traders can enhance their analytical arsenal through compatible charting tools, enhancing their trading proficiency.