Navigating Market Trends: A Comprehensive Guide to Chart Analysis

Weekly Chart: Unveiling the Bearish Signals
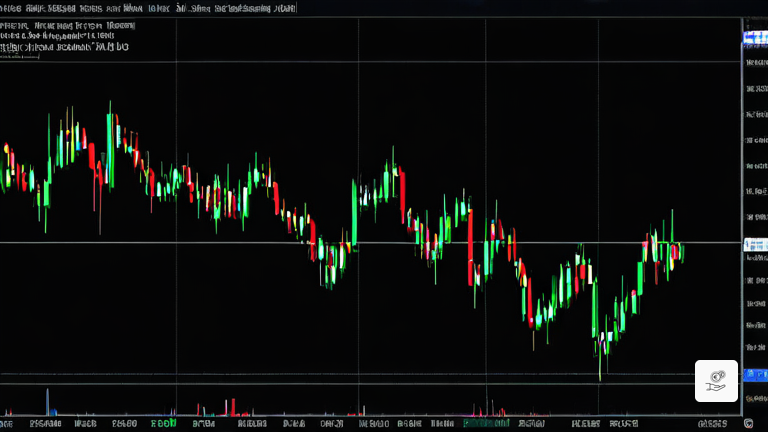
The weekly chart presents a compelling case for a bearish trend. The Gaussian channel, a respected technical indicator, has been flashing red since mid-2021, indicating sustained downward pressure on the price.
Adding to the bearish sentiment, the Relative Strength Index (RSI) currently stands at 58.39, hovering near the overbought territory. This suggests that the market may be nearing a point where selling pressure could intensify.
Daily Chart: A Glimpse of Potential Reversal
The daily chart offers a somewhat contrasting perspective. The price action is currently trading below both the 50-day and 100-day Simple Moving Averages (SMAs), reinforcing the bearish outlook.
However, a recent upward movement towards these averages hints at a possible retest. Additionally, a golden cross has formed, although it’s important to note that moving averages are lagging indicators and should be interpreted with caution.
Bearish Bias Trade: A Calculated Approach
Given the bearish signals emanating from the weekly chart, a short position may be a prudent consideration. The pivot point around 122’4 serves as a potential resistance level where the price may encounter selling pressure.
To mitigate risk, a stop loss can be strategically placed above the most recent swing high. Remember, market analysis is not an exact science, but rather a tool to guide our trading decisions.
It’s crucial to monitor these levels diligently, remain adaptable, and embrace new information as the market unfolds. By adhering to these principles, traders can navigate market trends with greater confidence and precision.


