Navigating Market Uncertainties: A Comprehensive Analysis of Key Chart Patterns

Weekly Chart: Indecision and Consolidation on the Horizon
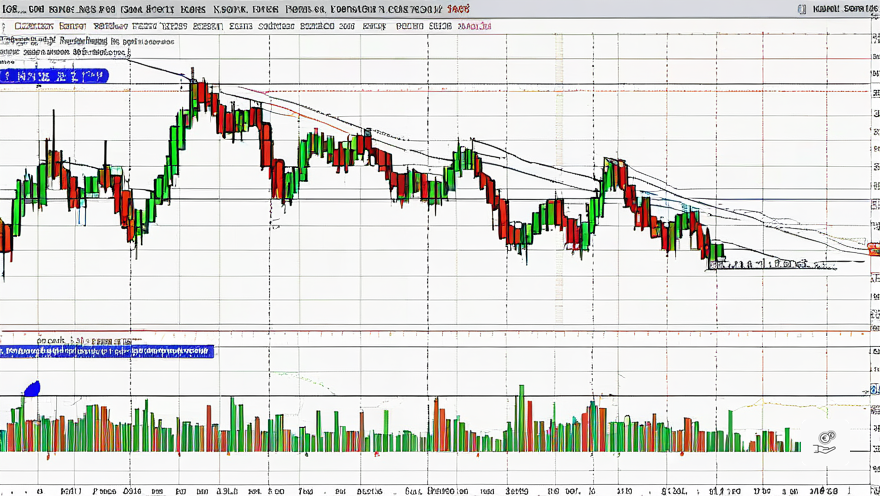
The weekly chart presents a tapestry of spinning tops hovering near the recent all-time high, hinting at a state of indecision within the market. This formation suggests a potential pause in the relentless upward momentum we have witnessed in recent times.
RSI Overbought: A Cautionary Signal
Adding to the uncertainty, the Relative Strength Index (RSI) has ventured into overbought territory, currently hovering at 71.31. This elevated reading warns of a potential correction or consolidation period.
Bullish Momentum Wanes: Signs of a Pause
Prior to the emergence of spinning tops, the market enjoyed a remarkable run with only one red week out of the past fourteen. Such an extended period of bullish price action cannot be sustained indefinitely, which explains the current indecision and the likelihood of a forthcoming consolidation or retracement.
Key Levels to Watch on the Weekly Chart
Resistance: A Ceiling to Break
The area around 38700 has emerged as a formidable resistance level, acting as a ceiling for further price appreciation. A decisive break above this threshold could signal a continuation of the uptrend, but the overbought RSI and the extended bullish run warrant caution.
Support: A Lifeline to Hold
Should the market experience a downturn, the next significant level of support lies in the zone around the previous consolidation area, at approximately 37000. This level could provide a cushion and prevent a precipitous decline.
Daily Chart: Bearish Signals Emerge
Zooming into the daily timeframe, we encounter a bearish break in the prevailing trend line. This break suggests a shift in market sentiment and a potential reversal of the recent uptrend.
Support Level: A Lifeline in Uncertain Times
Despite the bearish signals, the price is currently hovering above a crucial support level at 38389.00. This level could act as a temporary lifeline, preventing a sharp decline in prices.
Key Levels to Watch on the Daily Chart
Immediate Support: A Crucial Line of Defense
The support level at 38389.00 is paramount. A sustained hold above this level is essential for bulls to regain control and prevent a further downturn.
Break of Support: A Potential Avalanche
Conversely, a decisive break below the support level at 38389.00 could trigger a wave of selling pressure, potentially targeting the next support zone.
Hourly Chart: Consolidation and Pivot Points
Shifting our focus to the hourly Heikin Ashi chart, we observe a consolidation phase taking shape. The price oscillates around the pivot point level, indicating a period of indecision and uncertainty.
Key Levels to Watch on the Hourly Chart
Pivot Point: A Battleground for Control
The pivot point at 38579 acts as a pivotal level. Holding above this point is crucial for bulls to maintain control and prevent a further decline.
Resistance 1: A Hurdle to Overcome
The 38663 level represents a potential resistance level. If buyers step in with sufficient volume, we could witness a retest of this level.
Potential Trades: Navigating the Uncertainties
Bullish Scenario: A Glimmer of Hope
Should we witness a surge in strength and a sustained hold above the support level at 38389.00, a long position could be considered. A stop loss should be placed below the recent low, with a target set at the 38605 resistance level.
Bearish Scenario: A Cautionary Tale
Alternatively, a break below the support level at 38389.00 could present a short opportunity. The target would be the next support level, with a stop loss placed just above the support level.
Final Thoughts: Cautious Optimism Amidst Uncertainties
While the current market conditions present a mix of bearish signals, including overbought RSI readings and a break in the daily trend line, the overall market structure remains within an uptrend. We maintain a cautious stance but refrain from adopting a bearish outlook until further confirmation emerges.
A prudent strategy involves awaiting a clear directional signal at the support level on the daily chart. Should the support hold, we could witness a resumption of the uptrend. Conversely, a break below the support level could signal a deeper retracement.
Vigilance is paramount in these uncertain times. Stay alert and prepared to act accordingly as the market unfolds.


