Unveiling the Nuances of Double Tops: A Comprehensive Guide for Traders

Introduction: Navigating the Realm of Double Tops
In the ever-evolving landscape of financial markets, technical analysis serves as a beacon of guidance for traders seeking to decipher the intricate dance of price movements. Among the plethora of chart patterns that adorn the trading arena, double tops stand out as a pivotal reversal formation, signaling a potential shift in market sentiment.
Deciphering the Anatomy of a Double Top
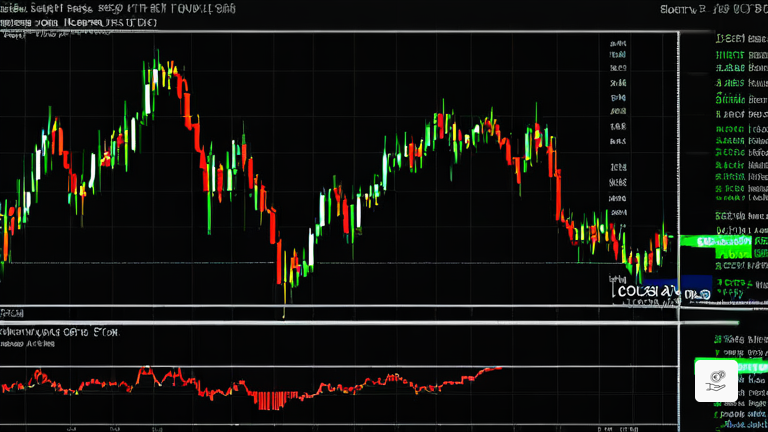
A double top, as its name suggests, is characterized by two distinct peaks that emerge at or near the same price level. These peaks are separated by a trough, a temporary dip in price that precedes the second peak’s ascent. It’s important to note that the peaks do not have to be identical in height; often, the second peak surpasses the first, creating a sense of false hope for bullish traders.
The Significance of Volume and Time
Volume and time play crucial roles in identifying double tops. The first peak should exhibit significantly higher volume than the second, indicating a waning buying momentum. As the trough forms, a noticeable decrease in volume should be evident. Additionally, the time it takes for the two peaks to develop and the depth of the trough between them contribute to the likelihood of a reversal.
Confirming the Reversal: A Price Bar’s Closure
The confirmation of a double top hinges on a price bar closing below the trough on substantial volume. This decisive move signals a shift in market sentiment, indicating that the upward trend is likely to reverse. The distance between the trough’s lowest point and the trendline connecting the two peaks serves as the measuring objective for the reversal.
Measuring the Downward Trajectory
Once the double top is confirmed, the price objective can be determined by measuring the distance between the breakout point and the trough’s lowest point. This measurement is then projected downward to establish the target price level.
Retesting the Resistance and Adding to Positions
After the breakout, the area where the trough formed transforms into a resistance level. It’s not uncommon for the price to retest this level before reaching the price objective. Aggressive traders may seize this opportunity to augment their positions if volume and time patterns suggest a high probability of trend reversal.
The Art of Stop Placement: Navigating the Dilemma
Determining the optimal stop placement is a subject of ongoing debate among traders. While there’s no universally accepted solution, historical market data provides valuable insights. Placing a stop at new highs may seem logical, but the market often targets these obvious levels, potentially reducing the risk-to-reward ratio to an undesirable 1:1.
Alternative Stop Placement Strategies
Alternative stop placement strategies include the 50% retracement of the measured move, Bollinger bands, or short-term moving averages. These methods offer sound risk management approaches, allowing traders to establish a predefined plan before entering a position.
The Challenges of Identifying Double Tops in Formation
Identifying double tops during their formation can be challenging due to the potential for price consolidation. The trough serves as a crucial support area while the pattern is developing, sometimes leading to the formation of other patterns like rectangles or triangles. Therefore, it’s imperative to exercise patience and wait for a decisive price break below the trough support area for confirmation.
Avoiding False Breakouts: A Prudent Approach
Adhering to a disciplined approach can help traders avoid the pitfalls of false breakouts. By waiting for a price bar to close below the trough support area, traders can minimize the risk of being trapped in a misleading scenario.
Conclusion: Mastering the Double Top Reversal
Double tops are powerful reversal patterns that provide valuable insights into potential market shifts. By understanding the nuances of their formation, confirmation, and implications, traders can enhance their decision-making and navigate the financial markets with greater confidence. Remember, patience and discipline are key to unlocking the full potential of this versatile chart pattern.


