Unveiling the Potential of Volume Indicators in Achieving Trading Balance
Exploring the Dynamic World of Trading Volume Indicators
Understanding the Intricacies of the On-Volume Balance Metric
The realm of momentum gauges offers a plethora of options that often leave traders in a state of bewilderment when attempting to optimize their performance. Among the array of tools available, the on-volume balance metric emerges as a prominent choice. This indicator, rooted in volume flow data, serves as a valuable asset in predicting price fluctuations and capturing momentum in the market. In this comprehensive guide, we delve into the essence of the OBV metric, elucidating its utility, advantages, drawbacks, and comparative analysis with other indicators.
Deciphering the Essence of The On-Balance Volume Indicator (OBV)
The on-balance volume indicator (OBV) stands as a momentum gauge that leverages volume flow insights to aid traders in anticipating shifts in stock prices. A different perspective on the OBV metric portrays its role in reflecting crowd sentiment to predict market outcomes, whether bullish or bearish, and to quantify buying and selling pressures in the market.
Joseph Granville introduced this indicator in 1963 through his book ‘New Key to Stock Market Profits,’ emphasizing the significance of volume in monitoring price variations. The core premise of the OBV is built on the notion that heightened trading volume, even initially inconsequential to prices, eventually influences price movements based on prevailing order types.
Initially groundbreaking, the OBV indicator retains its popularity among technical traders, although the efficacy of volume-based indicators has diminished due to market volume manipulations. Presently, traders utilize the OBV to identify the presence of institutional and retail investors in the market, discerning their respective volume contributions and activities.
Mastering The OBV Indicator: Operational Mechanisms and Applications
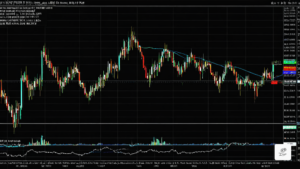
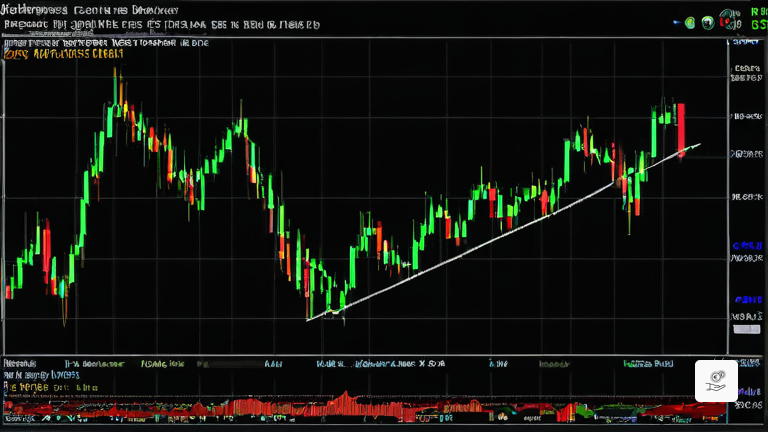
To comprehend the operational dynamics of the OBV indicator, a closer inspection of its functionality is imperative. The OBV operates as a cumulative indicator, adjusting volume totals with every price fluctuation of the instrument.
In practical terms, when prices rise, volume increments are added to the OBV, while price drops prompt volume deductions. Stability in prices warrants no volume adjustments. The OBV value oscillates positively or negatively based on daily price changes, with its significance lying more in trend direction and slope than numerical values.
The essence of the OBV indicator lies in its representation on charts, where the focus shifts from numerical values to line trajectory. Traders are advised to monitor the line’s slope and direction to gauge buying and selling pressures accurately, as the indicator’s core principle asserts that price movements should align with trading volume.
Cracking The Code: Calculating On-Balance Volume
The calculation of the OBV indicator follows a straightforward formula, where the current OBV level is determined by the previous day’s OBV level adjusted by the latest trading volume. This simplistic formula accommodates three scenarios based on the relationship between today’s and yesterday’s prices.
Illustratively, when today’s price surpasses yesterday’s closing price, the OBV increments by today’s volume. Conversely, a lower price triggers an OBV decrement by today’s volume, while equal prices maintain the OBV level. Practical examples further elucidate the OBV calculation process, accentuating its simplicity and applicability in real-world scenarios.
Leveraging On-Balance Volume: Strategic Applications and Market Insights
Contemporary traders harness the OBV indicator to validate trends, identify reversals, detect overbought or oversold market conditions, among other applications. The indicator’s proficiency in discerning institutional and retail investor engagement fosters practical implications for traders seeking strategic advantages.
An emphasis on spotting divergences between price and volume unveils opportunities for traders to capitalize on impending market movements, whether in predicting price drops or surges. The strategic approach involves aligning trading decisions with OBV signals to counter prevailing trends effectively.
Sophisticated trading entities elevate this strategy by orchestrating price manipulations to steer retail investors towards favorable trends, ultimately capitalizing on market momentum. By mastering OBV interpretations, traders navigate away from unstable market trends influenced by artificial forces.
Navigating Market Realms: Applicability of The OBV Indicator
An essential consideration pertains to the OBV indicator’s compatibility, akin to other volume metrics, with markets featuring exchange volume, such as lit markets and official trading platforms. While the OBV serves as a valuable adjunct to trading strategies, prudent traders integrate it within a holistic framework for enhanced market insights.
Configuring the OBV on trading charts necessitates minimal adjustments, as its automated calculations obviate customization requirements. Traders are encouraged to optimize chart settings for improved visual clarity, ensuring efficient integration of the OBV within trading analyses.
Maximizing Trading Proficiency with On-Balance Volume Strategies
Strategic Frameworks: Unveiling Trading Opportunities with OBV
The simplicity and potency of the OBV indicator render it a favored choice across diverse trader categories, from novices to seasoned professionals. A fundamental tenet of trading in alignment with the OBV underscores a strategic approach aimed at capitalizing on the indicator’s directional cues.
Prominent trading strategies rooted in the OBV encompass breakout identification, divergence recognition, and exhaustion move anticipation. Traders leverage OBV signals to forecast market shifts, validate trend continuations, and identify opportune entry and exit points within dynamic market conditions.
Empowering Trading Decisions: Real-world Applications of OBV Strategies
An illustrative examination of trading scenarios employing the OBV indicator elucidates its role in identifying trend reversals and price rejection points. Notable examples underscore strategic amalgamations of OBV with moving averages to enhance price forecasting accuracy.
Analyzing the Pros and Cons of Embracing the OBV Indicator
Advantages and Drawbacks of On-Balance Volume Integration
The on-balance volume indicator, despite its widespread acclaim, presents a blend of advantages and limitations that merit consideration for traders. An insightful evaluation of the indicator’s attributes unveils its potential benefits and pitfalls, enriching traders’ decision-making processes.
Advantages of the OBV encompass user-friendly operability, universal market applicability, and strategic enhancement of trading methodologies through volume-driven signals. Conversely, challenges such as susceptibility to volume manipulations, interpretational blind spots, and reliance on supplementary indicators pose notable constraints to traders.
Distinguishing On-Balance Volume from Alternative Indicators
A comparative analysis between the on-balance volume indicator and alternative metrics sheds light on their unique functionalities and operational variances. By discerning the distinctions between the OBV and other indicators, traders can optimize their analytical frameworks and refine trading strategies for enhanced market insights.
Comparison with indicators like the cumulative delta volume and accumulation/distribution indicator elucidates the OBV’s comprehensive volume assessment versus niche volume insights. Traders leverage these distinctions to bolster decision-making precision and validate trading signals across diverse market scenarios.
Adapting to Evolving Market Realities: Relevance of the OBV Indicator Today
The contemporary trading landscape, characterized by escalating volume and volatility, necessitates a nuanced evaluation of volume indicators’ efficacy, including the on-balance volume metric. Amidst modern market nuances, the judicious application of the OBV in conjunction with complementary indicators emerges as a prudent strategy for optimizing trading outcomes.
While the OBV indicator retains value across market conditions, its utility during volatile market phases warrants caution. Unpredictable price fluctuations, trading anomalies, and artificial volume injections underscore the importance of integrating the OBV within a diversified analytical framework to mitigate risks and enhance decision-making acumen.
The on-balance volume indicator, when judiciously combined with other indicators, augments traders’ ability to anticipate trend shifts, validate signals, and navigate dynamic market landscapes effectively. As a complementary tool within a comprehensive trading strategy, the OBV enriches traders’ analytical arsenal and fortifies strategic trading initiatives.
Frequently Asked Questions (FAQ) About On-Balance Volume Indicator
Decoding Common Queries Surrounding the OBV Indicator
1. What does a negative on-balance volume signify?
A negative on-balance volume indicates that today’s price is lower than yesterday’s closing price, accompanied by higher trading volume. This scenario typically signals intensified selling pressure and a potential bearish trend in the market.
2. When is the on-balance volume indicator most accurate?
The on-balance volume indicator exhibits optimal accuracy in stable market conditions, particularly when applied across longer time frames. Traders leverage the OBV in conjunction with other indicators for identifying trend reversals, confirmations, and divergences, thereby enhancing its reliability and precision.